Most wearables can tell you whether you’re over or undertraining, but they don’t capture how your body is responding to everything else: poor sleep, work stress, illness, travel. Zenith’s recovery score captures all of it: a single number from 0-100% that reflects how prepared your body is to take on strain today.
The Recovery Scale
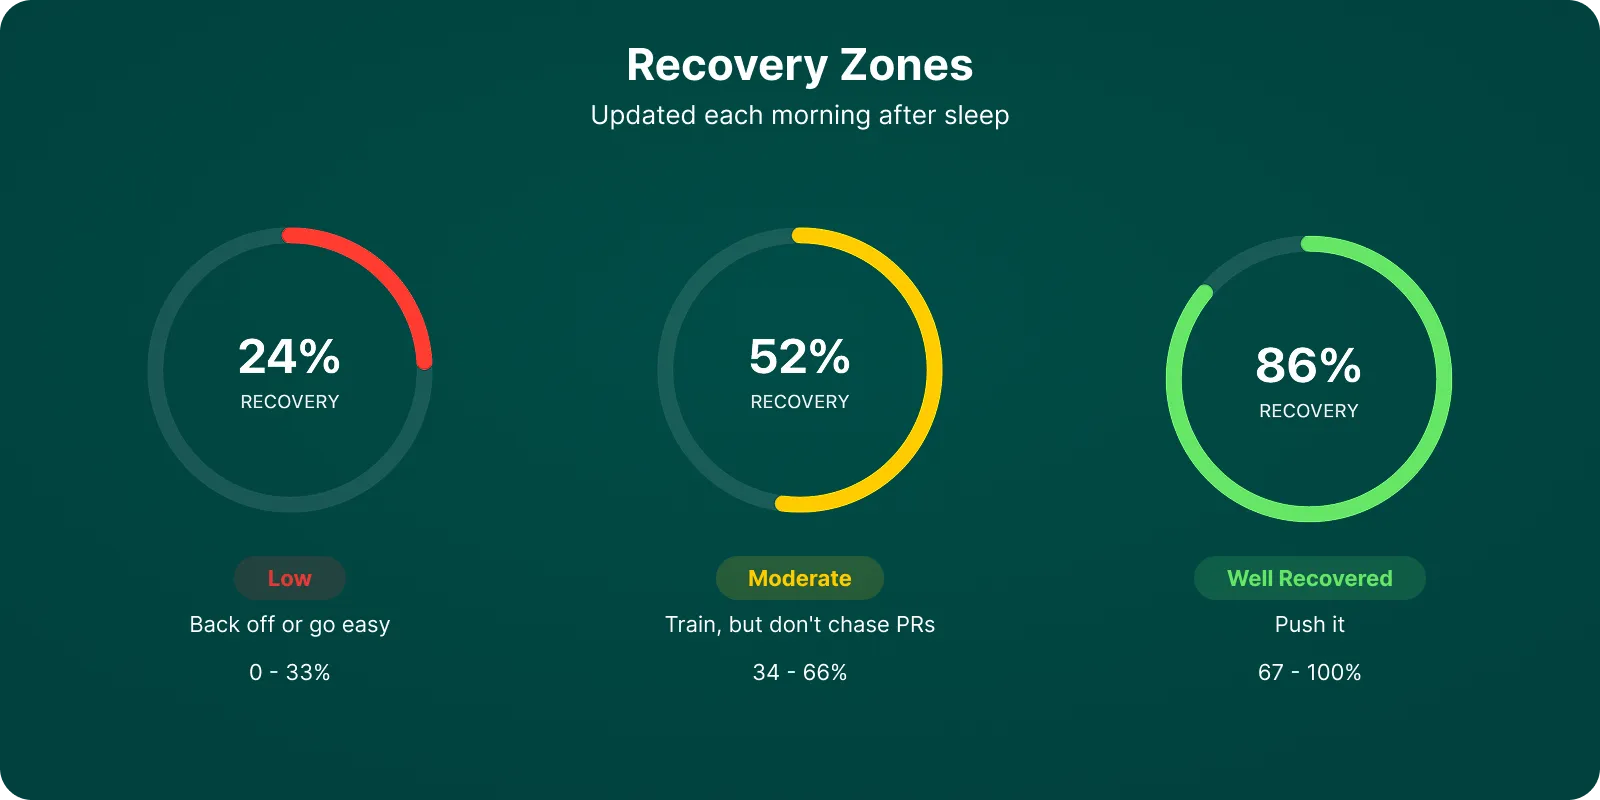
Recovery runs from 0-100% across three zones:
| Zone | Range | What it means |
|---|---|---|
| Low | 0-33% | Physiological markers indicate incomplete recovery. Lighter activity recommended. |
| Moderate | 34-66% | Partial recovery. You can train, but high-intensity work may not be productive. |
| Well Recovered | 67-100% | Physiological markers indicate readiness for demanding training. |
The score updates each morning after your sleep data comes in. Yesterday’s strain, last night’s sleep, and your body’s overnight signals all feed into the number you see when you wake up.
What Goes Into It
Six factors drive the score.
| Factor | What it measures |
|---|---|
| HRV | Heart rate variability measures the variation in time between heartbeats. Higher variability generally means your nervous system is relaxed and ready. Lower variability signals stress, overtraining, or illness. What matters is your personal trend over time, not comparisons with others. |
| Resting Heart Rate | Measured during sleep when your body is at its most consistent. When your resting heart rate rises above your personal baseline, it typically signals stress on the body: illness, dehydration, overtraining, alcohol, or accumulated fatigue. |
| Respiratory Rate | Breaths per minute during sleep. Often one of the first vital signs to shift when illness or overtraining is setting in, sometimes before you notice symptoms. |
| Sleep Performance | Hours slept divided by hours needed. Missing your sleep need consistently shows up in recovery. One short night is recoverable, but a string of them is not. |
| Sleep Quality | Sleep efficiency, deep sleep percentage, and REM sleep percentage all factor in. Two nights of equal duration can produce different recovery scores depending on how much time was spent in restorative stages. |
| Recent Strain | How hard you’ve pushed recently. A high-strain day doesn’t reset overnight. Accumulated strain from the past several days weighs on recovery even if yesterday was easy. |
Your Trend Matters More Than Any Single Day
A single recovery score is useful, but a week of them is more informative.
Recovery declining for five straight days means you’re accumulating fatigue, even if today’s number still looks moderate. Recovery climbing after a block of rest means you’re recovering well, even if today’s number isn’t green yet. The direction matters as much as the value.
Zenith needs about a week of data to establish your personal baselines. After that, it compares today’s metrics against your history, not population averages. Your HRV at 45ms might be terrible for one person and perfectly normal for another. Zenith learns what’s normal for you.
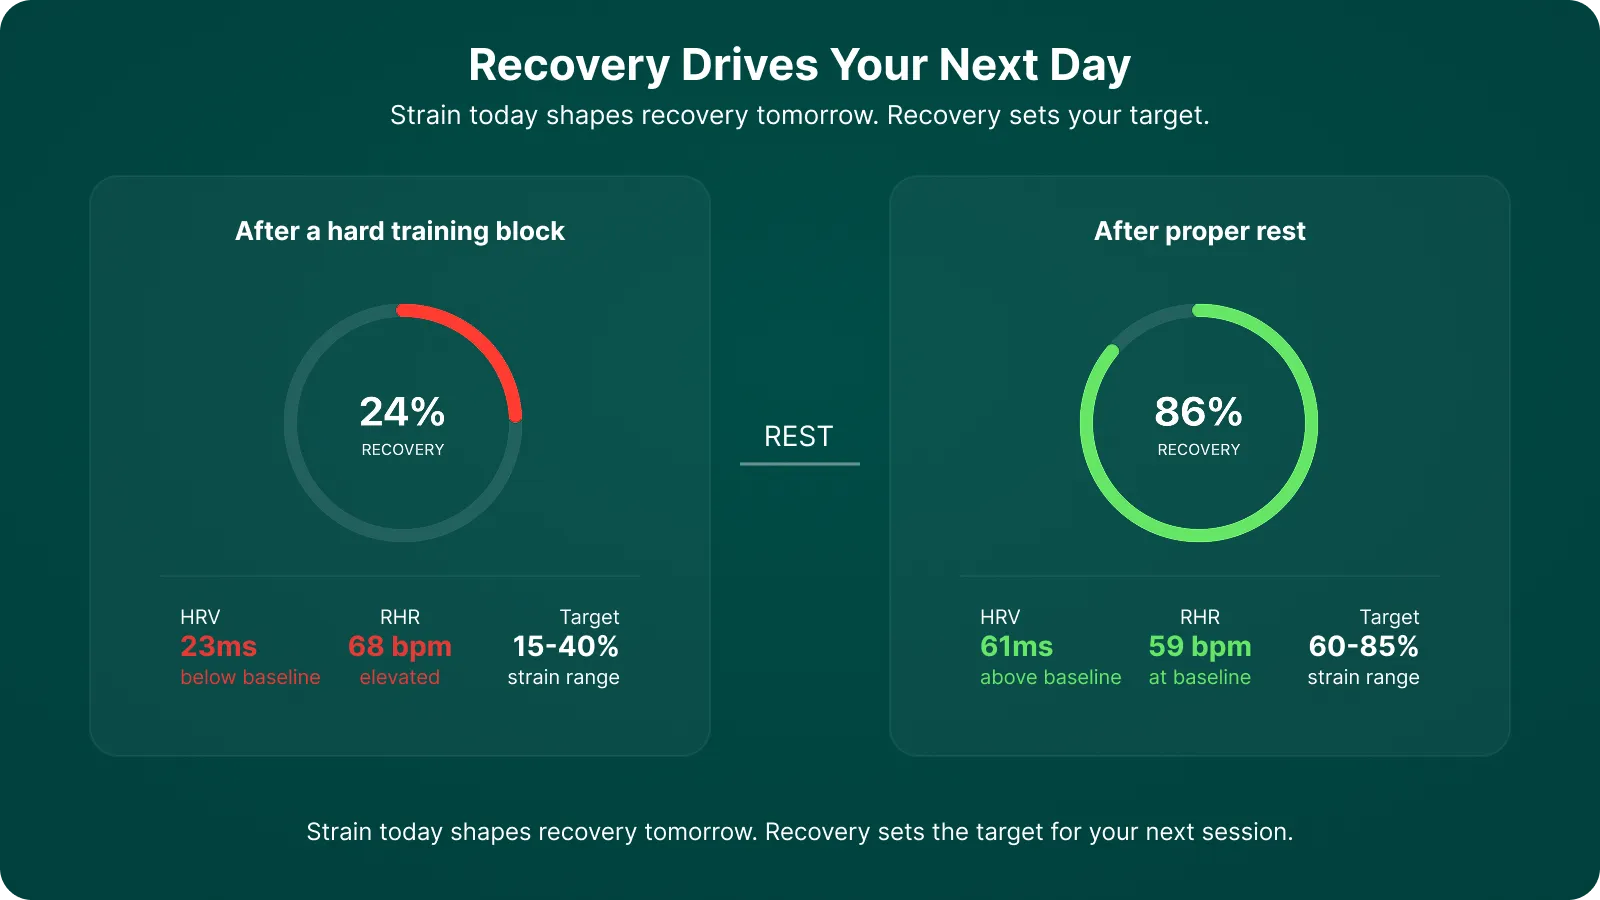
Recovery Tells You How Hard to Push
Recovery feeds directly into your recommended strain range.
When recovery is high, the target range widens and shifts upward. When recovery is low, it tightens and drops. The recommended range shows up as an arc around the strain ring on your home screen.
This creates a feedback loop. Strain today affects recovery tomorrow, and recovery determines your recommended strain for the next day. Over time, this makes training decisions more consistent: you have a physiological basis for when to push and when to back off.
For the full breakdown on how strain works, read How Zenith Measures Strain.
Why a High HRV Day Can Still Be a Low Recovery Day
It’s a well-established but counterintuitive pattern: a sudden spike in HRV combined with a drop in resting heart rate doesn’t always mean great recovery. Sometimes it’s the opposite. It’s called the parasympathetic rebound.
When you push hard enough, your autonomic nervous system can flip into deep parasympathetic dominance overnight as a protective response. HRV jumps. Resting heart rate drops. To a naive recovery algorithm, both signals look like “well recovered.” But what’s actually happening is your body forcing rest. The numbers look great because the system is in emergency-recovery mode.
Zenith catches this. When your HRV is significantly above your personal baseline AND your resting heart rate is well below it AND your recent strain has been high, the algorithm reads the pattern as parasympathetic rebound rather than blindly trusting the headline numbers. You might wake up to a 39% recovery on a day where HRV is 8 ms above baseline and RHR is 4 bpm below it. The score isn’t broken, it’s catching a fatigue signal hidden inside numbers that look good on the surface.
This is one of the screwier corners of HR-based recovery scoring, and it’s where naive algorithms get it wrong. Zenith treats your physiology as a system, not a leaderboard.
Why It Doesn’t Match How You Feel
The score uses objective physiological markers. How you feel on any given morning is influenced by caffeine, motivation, stress, and a dozen other factors that don’t necessarily predict physical readiness.
You can feel great but have suppressed HRV from overreaching. The score reflects that before you notice it. You can feel sluggish but be physiologically recovered. The markers say you’re ready even if your mood doesn’t agree.
This disconnect is expected. Subjective feel and physiological readiness are related but not the same thing.
Want to see your recovery score? Try Zenith. It’s free to start.